Lifetime Investment Calculator.
Simulate long-term portfolio growth using 55 years of historical market data — wars, booms, busts, and inflationary periods all included.
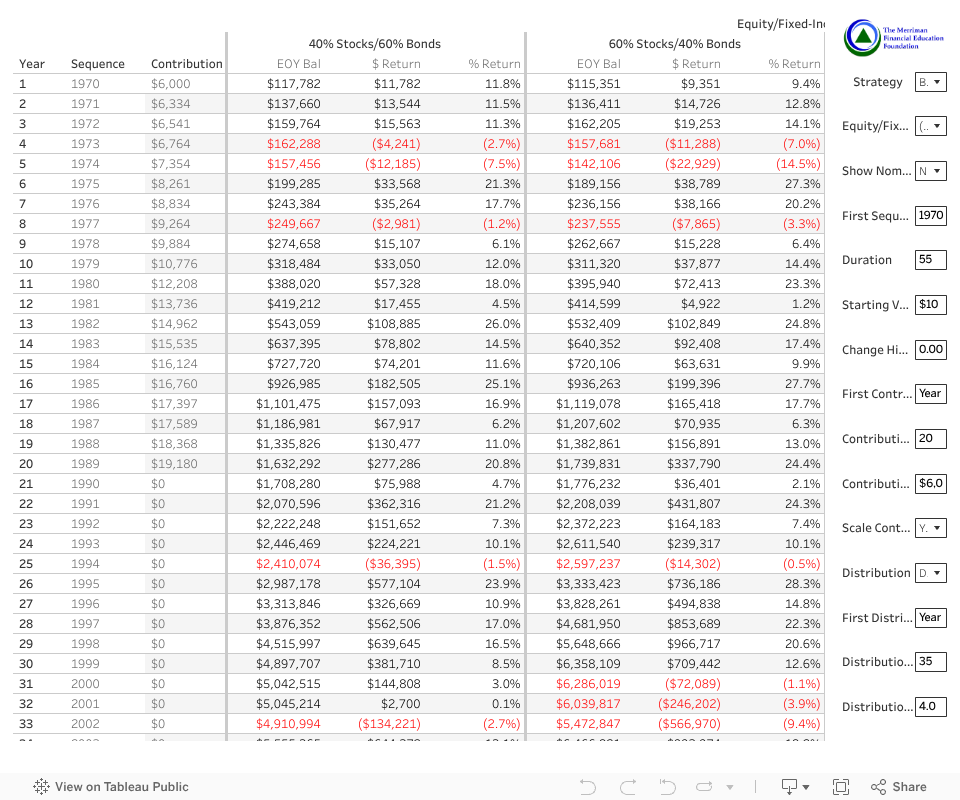
A dynamic, interactive lifetime simulator.
The Merriman Financial Education Foundation Lifetime Investment Calculator helps investors simulate long-term portfolio growth using historical market data. Built upon the "Fine Tuning Your Asset Allocation" 2026 update tables , it leverages 55 years of market history (1970–2024) — encompassing various economic cycles such as wars, booms, busts, and inflationary periods — to model potential investment outcomes over periods extending up to 200 years by looping through this historical sequence.
It's an educational tool — a hands-on way to explore how various investment strategies and asset allocations might perform over extended periods. The goal is to help you make informed choices aligned with your financial goals, not to predict the future.
Six levers, endless scenarios.
Run your scenarios.
The dashboard loads below. On desktop it fills the full width; on smaller screens, use the built-in Tableau controls to zoom and scroll.
Every setting, explained.
A full reference for every input on the dashboard — what it does and what values it accepts.
| Name | Description | Options / Range |
|---|---|---|
| Strategy | Choose from the 11 Merriman strategies you've been hearing about for years. |
|
| Equity / Fixed Income | Toggles the columns from 0% stock / 100% bond to 100% stock / 0% bond. | 0% – 100% equity |
| Nominal or Real | Display values in future (nominal) or today's (real) dollars. | Nominal · Real |
| First Sequence Year | The first year in your sequence of returns — e.g., simulate a portfolio that started right before the 1973–74 or early-2000s bear markets. | 1970 – 2024 |
| Duration | Total number of years to display. | 1 – 200 years |
| Starting Value | A lump sum to start with. | Minimum $0 |
| Change Historical Returns By | Adjusts the historical return by the input value. For example, if the historical return was −5% in a given year and you enter −1%, the calculated return becomes −6%. | −100% to +100% |
| First Contribution Year | The first year contributions begin. | 1 – 200 |
| Contribution Duration | Duration of contributions. | 0 – 200 years |
| Contribution Amount (Nominal) | Nominal amount contributed at the beginning of each year. | Minimum $0 |
| Scale Cont./Dist. w/ Inflation | Scales contributions and distributions with inflation so you contribute or distribute the same real value each year. | Yes · No |
| Distribution | Toggles the table between showing growth columns ($ Return & % Return) vs. showing fixed or flexible distributions. |
|
| First Distribution Year | The first year you start taking a distribution. Ignored if Distribution = "Don't Calculate." | 1 – 200 |
| Distribution Duration | The number of years you take a distribution. Ignored if Distribution = "Don't Calculate." | 1 – 200 years |
| Distribution % | Percent to take for your fixed or flexible distribution. Fixed uses the percentage in the first distribution year; Flexible recalculates each year. Fixed can be scaled with inflation via the Scale parameter. Ignored if Distribution = "Don't Calculate." | Minimum 0% |
Videos to get you started.
Available on the Merriman YouTube channel — from the launch video with Paul, Chris, Daryl & Craig to deep-dive tutorials and supporting evidence.
Questions we hear often.
The dashboard is built from the 2025 Fine Tuning tables (1970–2024). We have 55 years of data, which we loop through so you can evaluate up to 200 years of returns.
We only have 55 years of data from 1970 to 2024. Looping through the sequence lets you see how returns could play out across multiple generations. Pick any starting year — after 2024, the sequence loops back to 1970.
All contributions are added at the beginning of the year.
All distributions are taken at the beginning of the year.
Inflation is based on the historical U.S. Consumer Price Index for each sequence year.
Each sheet can be downloaded to Excel using the download button in the Tableau toolbar. The "Crosstab" option works best for exporting a view similar to the on-screen visualization.
Please email craig@paulmerriman.com for any technical issues.
The Merriman Online Calculator is built using Tableau Public.
We appreciate your interest! Please link to this page where possible — it will always have the most current version.
It felt like one could model multiple lifetimes across a 200-year horizon. The choice was inspired by Benjamin Franklin's 200-year bequest to the cities of Boston and Philadelphia.
The Fine Tuning tables include adjustments for expenses. We used real expenses where data was available and estimated expenses where it wasn't.
Red text means the previous year's end-of-year balance was greater than the current year's end-of-year balance — i.e., the portfolio shrank that year.
We discussed this extensively during the build. We purposefully chose not to show future calendar years because this tool isn't able to predict anything. Once the sequence exhausts our data, it loops back to 1970 — which is harder to interpret if labeled with future dates.
Contributions and distributions stay flat in real terms when "Scale Contr./WDL w/ Inflation" is set to Yes and "Nominal or Real" is set to Real. Without scaling, they decline in real terms because purchasing power decreases each year. If you keep up with inflation, purchasing power stays constant.
The field takes a value between −100% and +100% and adds that value to the return for all years. Enter −10% and every year's return is reduced by 10 percentage points — so a −5% year becomes −15%.
The Contribution Amount (Nominal) parameter is always entered in nominal dollars. The table then adjusts the contribution amount in real terms relative to the first year of the table.
For example: if you start the evaluation in year 1 and contributions begin in year 10, the first contribution appears in year-1 dollars, adjusted for inflation — mirroring the behavior when you choose Nominal (where the year-10 contribution is in year-10 dollars and inflates from there).
Updates and revisions.
- Launched the 2025 calculator update based on the 2025 Fine Tuning tables. Table numbers are the same as last year.
- Updated default values to reflect a 55-year duration and a 35-year distribution duration.
- Launched the 2024 calculator update based on the 2024 Fine Tuning tables. Table numbers are different this year.
- Updated default values to reflect a 54-year duration and a 34-year distribution duration.
- Added the 2022 Fine Tuning tables. Table numbers are different this year and we added two new tables.
- Updated default values to reflect a 52-year duration and a 32-year distribution duration.
- Fixed the 1970 CPI and real return — the original was understating inflation in 1970 by about 5%.
- Significantly improved inflation calculations in real terms.
- Contributions and distributions remain flat when Nominal/Real = "Real" and Scale = "Yes" because purchasing power stays constant.
- Contributions and distributions decrease when Nominal/Real = "Real" and Scale = "No" because purchasing power decreases.
- Fixed a calculation presenting real contributions and distributions that overstated growth in real terms.
- Found and fixed rounding errors in the CPI calculation — these had an impact on real-term figures.
- Rounded underlying calculations to the nearest cent instead of the nearest dollar.
- Fixed distributions now end at $0 when you run out of money.
- Added bold vertical lines between equity and fixed income allocations for improved visibility.
Reach out to Craig.
For technical issues or feedback on the calculator, email Craig Appl — the developer behind this tool.
craig@paulmerriman.com →