Our Mission: Empower Do-It-Yourself Investors with Free Academic-based Research & Resources for Life-long Investing
Stock market making you nervous? How to control your investing losses.
Reprinted courtesy of MarketWatch.com
Published: April 27, 2023
To read the original article click here
Investors (and especially investment salespeople who are trying to attract business) like to focus on returns. But almost anyone who’s been investing for a while will tell you that losing money along the way can get your attention faster.
Unfortunately, losses are inevitable.
This is Part 3 in a series of articles I think of as Boot Camp for Investors 2023.
- The first installment was The best way to invest for retirement.
- The second was Seven simple portfolios that have beaten the S&P 500 for more than 50 years.
Today, I’ll help you learn to control your losses so you can stay the course.
One year ago, the U.S. stock market was down—though not in bear-market territory—and investors were nervous. Now, the market is up a bit for the year, and investors are still nervous.
The core of today’s message is the same as it’s been for decades: There’s an inevitable trade-off between the long-term returns of equities and the relative safety of bonds (although bonds have not seemed especially “safe” in the past year or so).
Investors who have a long-term focus and know they can avoid worrying about short-term and intermediate-term losses may want to invest most or all of their money in equities.
But for those who are highly concerned about losing what they already have, lower-yielding bond funds should play an important role in a retirement portfolio.
For many investors, especially those who are retired or getting close, the right balance is most likely somewhere in the middle. I’ll give you some historical information that may help you determine just where you fall in that “middle.”
However, I must warn you that there’s no perfect answer. We’re dealing with a tradeoff. If you want more of one thing, you will have to settle for less of something else.
In the table below, you will see compound annual growth rates along with a few measures of risk for three distinct combinations of the S&P 500 index SPX, 1.08% and a mix of bonds: intermediate-term government (50%), short-term government (30%), and TIPS (20%).
Results are from the past 53 calendar years and show equity allocations of 20% for very conservative investors, 50% for moderate investors and 100% for aggressive investors.
Table 1: Three choices of bonds vs. the S&P 500 index, 1970-2022
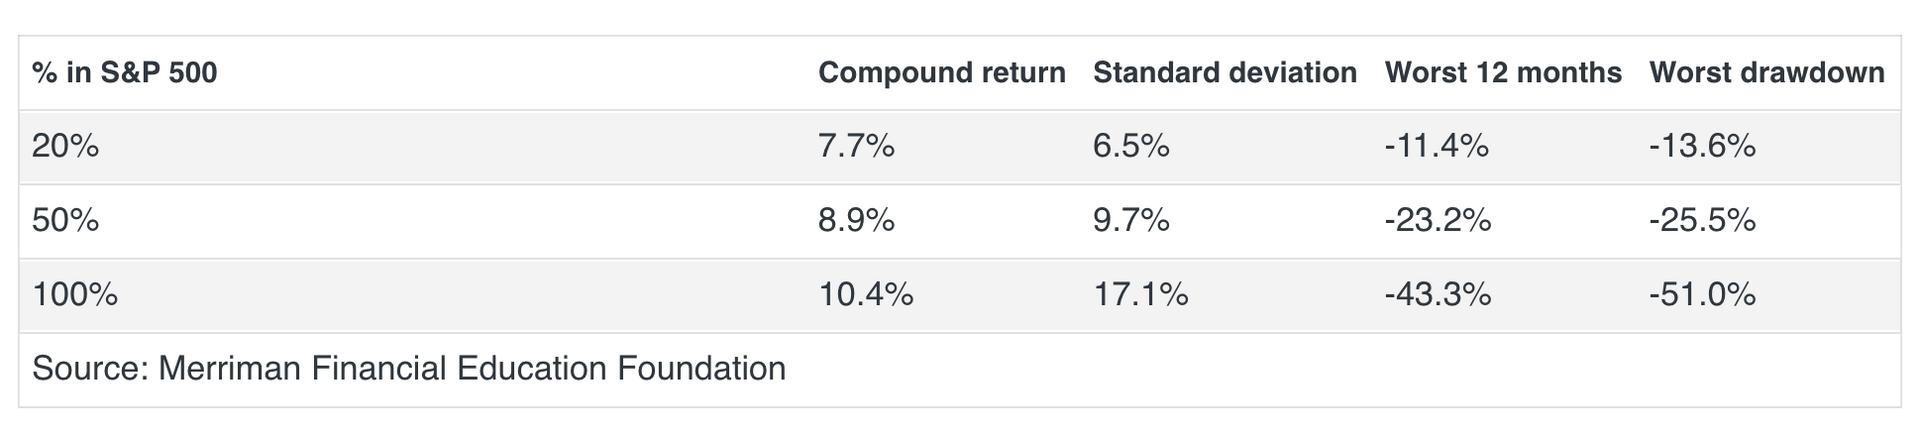
As you can see, even a conservative 20% equity allocation did not fully protect an investor from significant losses.
To help you understand the numbers: Standard deviation is a statistical measurement of variations from an average. It measures volatility, and higher numbers are generally considered more risky.
The last two columns measure the worst losses over any 12-month period and the worst drawdown.
Unless you are a professional statistician, you probably will never experience the angst of a standard deviation. But you will surely experience the discomfort of losses, even temporary ones. That’s why it’s worthwhile to think about the worst periods; they tell what you might have to endure in order to reap the long-term rewards of any given strategy.
Only you can determine your tolerance for risk in relationship to your desire for return. Personally, at age 79, I have adopted a moderate 50/50 allocation, and I have long believed that may be suitable for many investors.
Of course there are many choices beyond the three shown in the table above.
At the bottom of Table B1 on my website (which you can find here), you’ll see that every incremental increase in equity exposure brought a slightly higher long-term return. The differences might seem small, but over many years, every extra half a percentage point in return can make a huge difference.
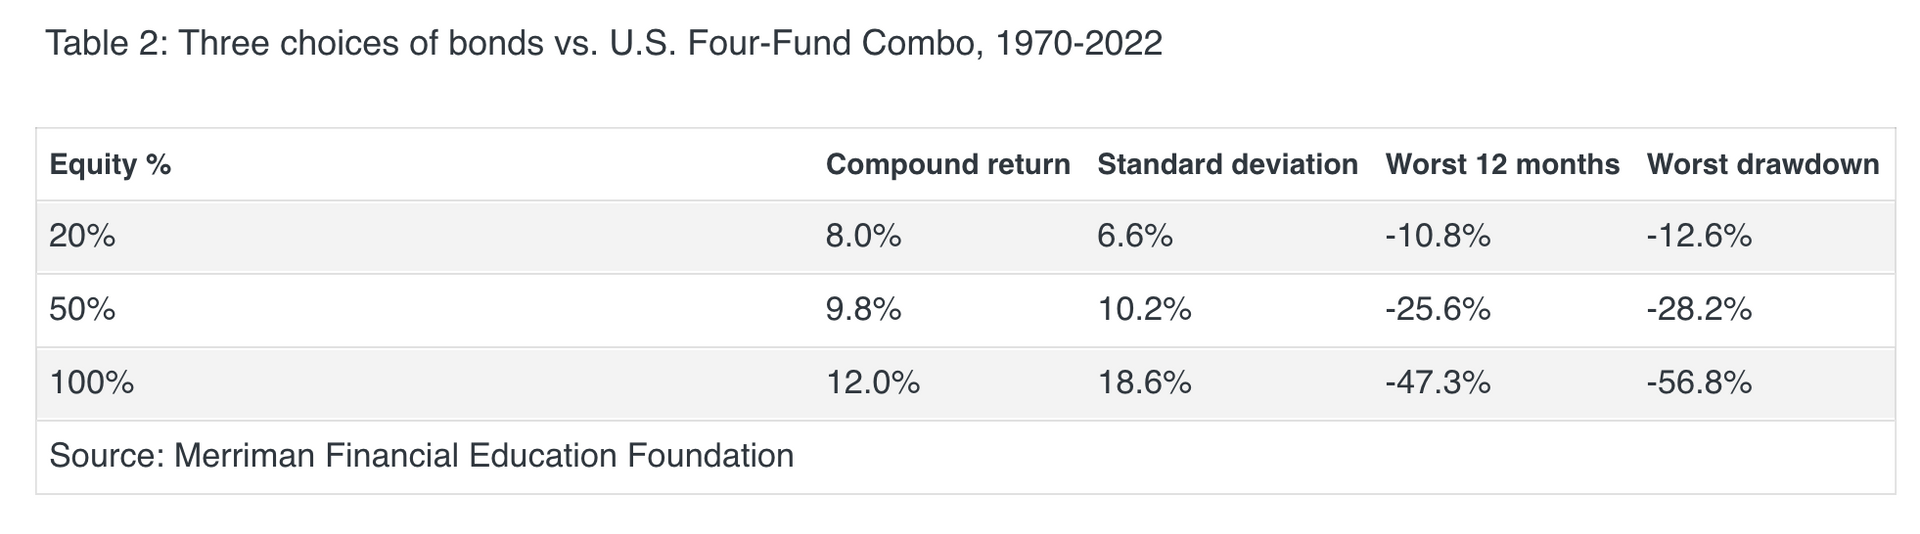
I also believe investors may achieve higher long-term returns without significantly higher risks if they diversify the equity side of their portfolios beyond the S&P 500.
One way to do that is with a simple four-fund U.S. portfolio made up of equal parts of the S&P 500, large-cap value stocks, small-cap blend stocks, and small-cap value stocks.
The following table shows 53-year results of doing that.
If you click on the link above to Table B1 and then scroll down, you’ll find more tables with details on nine portfolio combinations.
I don’t expect you to study all the numbers. But if you take the time to browse, you might find a combination that seems like a good fit for you.
Here are two fundamental lessons from all this data:
- Regardless of what combination of equities you use, adding more bonds reduces both risks and returns.
- Equally important, risks tend to be short-term. Over and over again, for patient investors, these portfolios have recovered. That’s how they produced their positive long-term returns.
One of your most important jobs as an investor is to navigate these trade-offs.
You won’t be surprised to know that there’s a great deal more to say on this topic. When you’re ready, check out my video and my separate podcast.
Richard Buck contributed to this article.
Paul Merriman and Richard Buck are the authors of We’re Talking Millions! 12 Simple Ways to Supercharge Your Retirement. Get your free copy.
Delivery Method. Paul Merriman will send stories to MarketWatch editors on a biweekly basis. Licensor may republish such stories 24 hours after publication on MarketWatch with the attribution.