Our Mission: Empower Do-It-Yourself Investors with Free Academic-based Research & Resources for Life-long Investing
These 7 simple portfolios have beat the S&P 500 for more than 50 years
Reprinted courtesy of MarketWatch.com
Published: April 11, 2023
To read the original article click here
Long-term investors who can manage a 10-fund equity portfolio, as I described last week, have what I consider the absolute best shot at attractive returns no matter what happens in the stock market.
This time, in Part 2 of a series for do-it-yourself investors, I’ll tell you how to get much of that benefit with fewer funds.
The Merriman Financial Education Foundation has created seven additional equity portfolios that handily outperformed the S&P 500 over the past 53 calendar years, from 1970 through 2022.
Each requires only one to five funds. If you’re looking for action without too much angst, one of these seven could be for you.
First, let’s get the baseline comparison on the table.
From 1970 through 2022, $10,000 invested in the S&P 500 SPX, +1.12% would have grown to $1.89 million. In the same period, a portfolio made up of equal parts of that index and nine other U.S. and international asset classes would have grown to $3.74 million.
Those additional asset classes made a mighty big difference.
The other asset classes are U.S. large-cap value stocks (US LCV), U.S. small-cap blend stocks (including both value and growth) (US SCB), U.S. small-cap value stocks (US SCV), real-estate investment trusts (REIT), international large-cap blend stocks (Intl LCB), international large-cap value stocks (Intl LCV), international small-cap blend stocks (Intl SCB), international small-cap value stocks (Intl SCV), and emerging markets stocks (Em Mrkt).
That’s a lot to keep track of, more than most people are willing to do.
A few years ago, I challenged Chris Pedersen, research director of our foundation, to find a way to achieve similar returns with no more than four funds.
Here are seven additional portfolios. In this table below (and available on my foundation’s website), you can see the breakdown of each fund and the asset classes that make up each one.
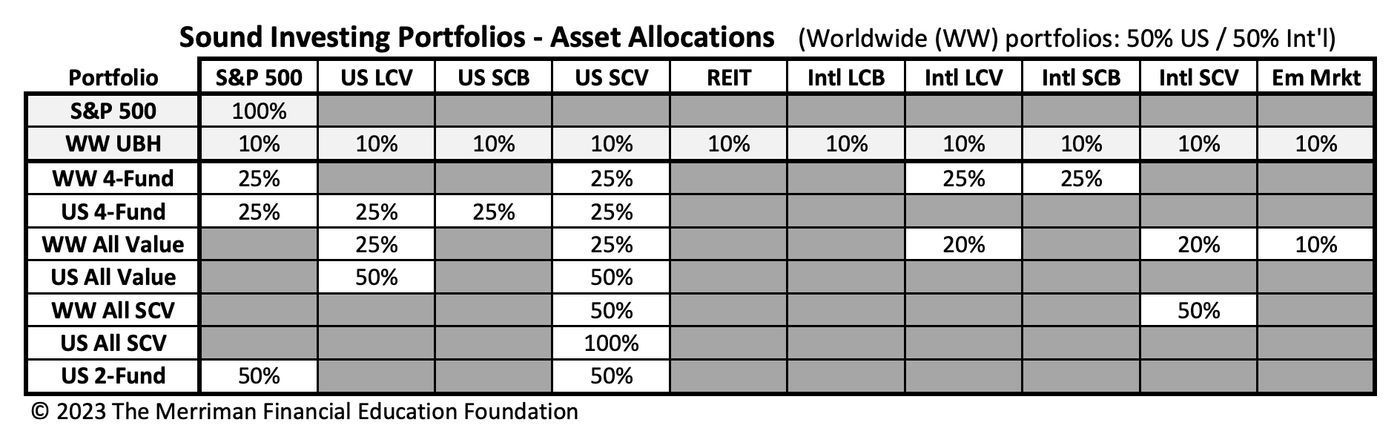
1. Chris came through, creating what we call the Worldwide Four-Fund portfolio. From 1970 through 2022, $10,000 would have grown to $3.92 million.
2. Of course, many people are skittish about owning funds with companies based outside the United States. For them, we created the U.S. Four-Fund combo. In this one, $10,000 grew to $4.09 million from 1970 through 2022.
If you’re wondering where these higher returns come from, the answer is simple: value stocks.
3. In our five-fund Worldwide All Value portfolio, $10,000 invested in 1970 would have grown to $5.34 million, nearly three times as much as the same investment in the S&P 500 alone.
4. For investors who want to stick with U.S. companies, there’s the U.S. All Value portfolio. In this simple but powerful combination, $10,000 would have grown to $6.43 million.
Compared with just the S&P 500, that seems pretty astounding. But hang onto your hat for a moment.
5. Both internationally and in the United States, small-cap value stocks have been the most productive of these asset classes. In our two-fund Worldwide All Small-Cap Value portfolio, $10,000 would have grown to an astonishing $9.14 million from 1970 through 2022.
That’s $7.25 million more than the S&P 500 alone.
6. The all-U.S. variation is the ultrasimple U.S. All Small-Cap Value portfolio. The 1970-2022 growth of $10,000 in this one-fund variation would have been $8.65 million.
U.S. small-cap value stocks have such a highly productive track record that they are part of every single suggested portfolio except the S&P 500 by itself.
By now, you might be thinking you’d like some of that small-cap value horsepower, but also some of the “safety” and familiarity of the good old S&P 500. That seems reasonable.
7. To meet that need, we created the U.S. Two Fund portfolio: equal parts of the S&P 500 and U.S. small-cap value stocks. From 1970 through 2022, an initial $10,000 would have grown to $4.48 million, more than twice as much as the S&P 500 by itself.
In Table 1, you can find these variations along with their 1970-2022 results.
Table 1
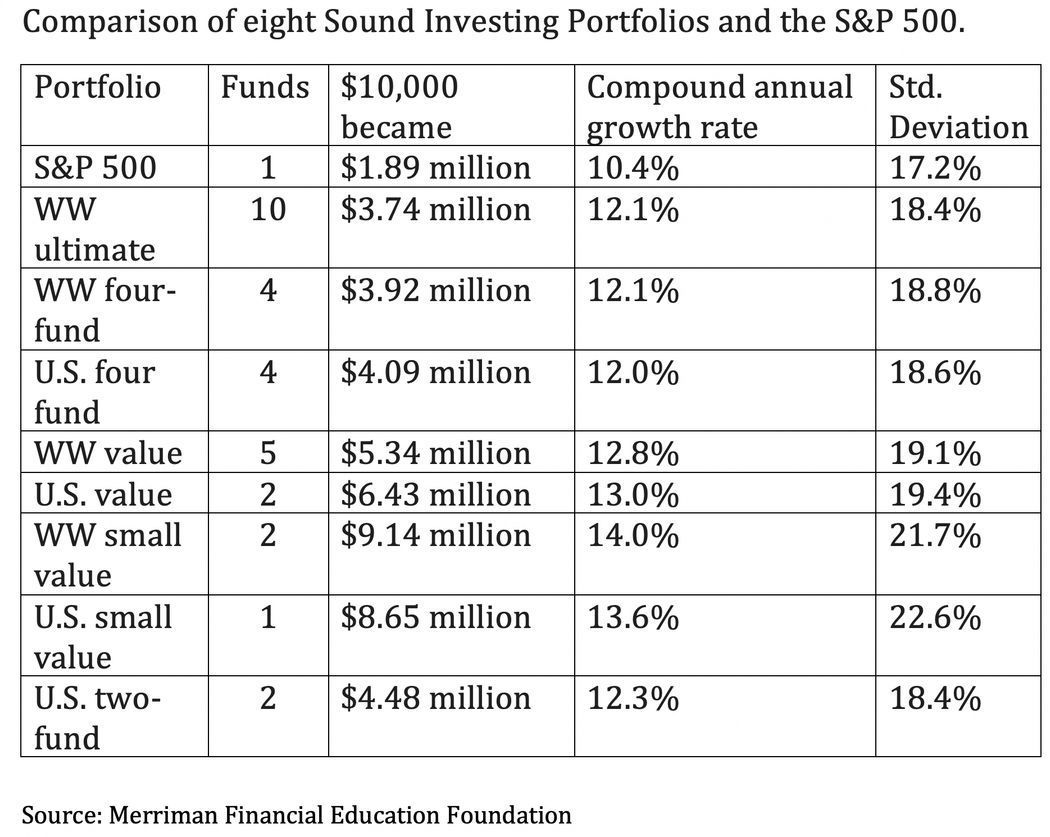
The far-right column, standard deviation, represent a common measure of risk. But in this case, I don’t think they are the best indicator. For many investors, a better measure involves the number of years in which they lose money.
Table 2
Delivery Method. Paul Merriman will send stories to MarketWatch editors on a biweekly basis. Licensor may republish such stories 24 hours after publication on MarketWatch with the attribution.
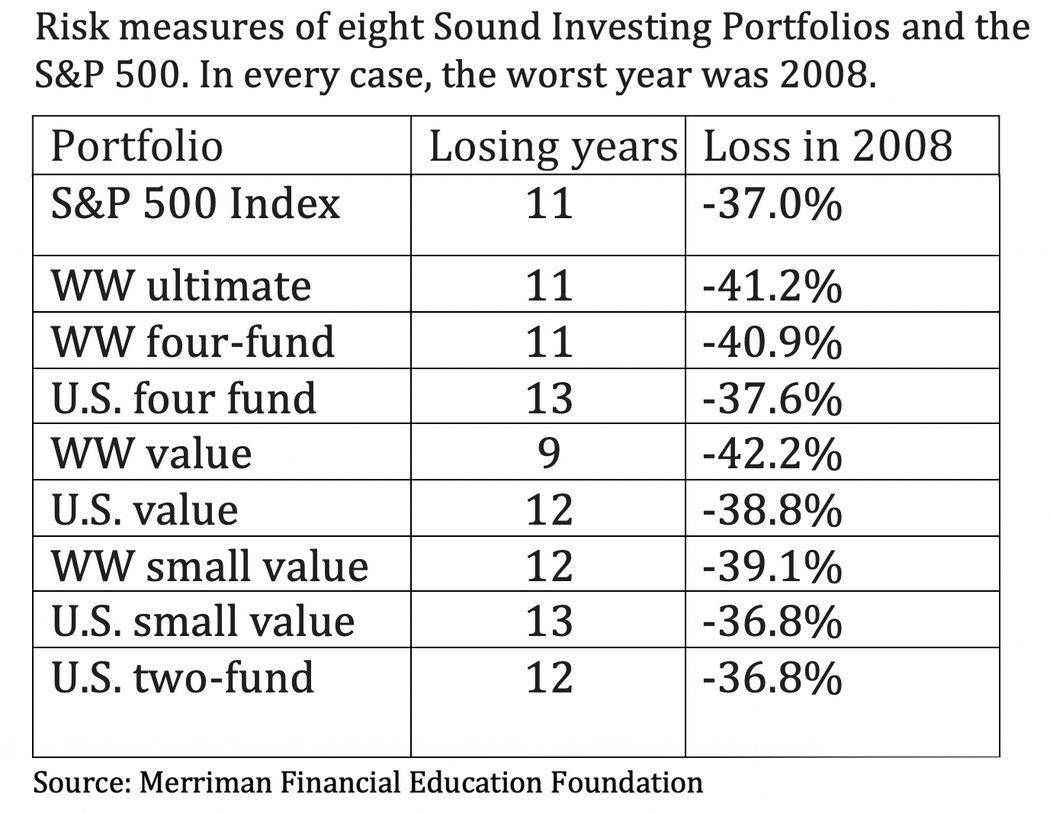
As you can see, the numbers in the far-right column aren’t that different from one another.
If you could accept a worst year of 36.8% (as in the bottom two rows), you could perhaps also live with a one-year loss of 42.2%, especially since it came bundled with the fewest losing years.
Of these alternative portfolios, the U.S. Two-Fund might be the most intriguing:
- It taps into the power of U.S. small-cap value stocks, and can easily be modified.
- You can substitute a target-date retirement fund or a balanced fund for the S&P 500.
- And the proportions don’t have to be 50/50.
To elaborate on ways investors can use these interesting portfolios, I have recorded a video and a separate podcast.
Richard Buck contributed to this article.
Paul Merriman and Richard Buck are the authors of We’re Talking Millions! 12 Simple Ways to Supercharge Your Retirement. Get your free copy.