
Our Mission: Empower Do-It-Yourself Investors with Free Academic-based Research & Resources for Life-long Investing
Juice up your S&P 500 fund for higher returns
Reprinted courtesy of MarketWatch.com
Published: April 20, 2021
To read the original article click here
In this article I’m arming you with information and insights to successfully whip your investment portfolio into shape and secure your long-term financial future. Welcome to the third installment of Investor Boot Camp 2024.
We started by making the multimillion-dollar case for investing in stocks instead of bonds. In the second installment of the series I showed you how to double your lifetime returns by diversifying into nine asset classes beyond the S&P 500 SPX.
As we continue that discussion this time, I’ll show you how to achieve similar results much more easily. As you will see, history suggests you can substantially increase your long-term equity returns with as few as two index funds — while you take less risk.
Is that too good to be true? Let’s find out.
To follow along, I suggest you look at this first table. In the left column you’ll see nine ways you can allocate the equity part of your portfolio. In each case, the line shows the percentage that each asset class plays. For example, the S&P 500 portfolio is 100% in that index.
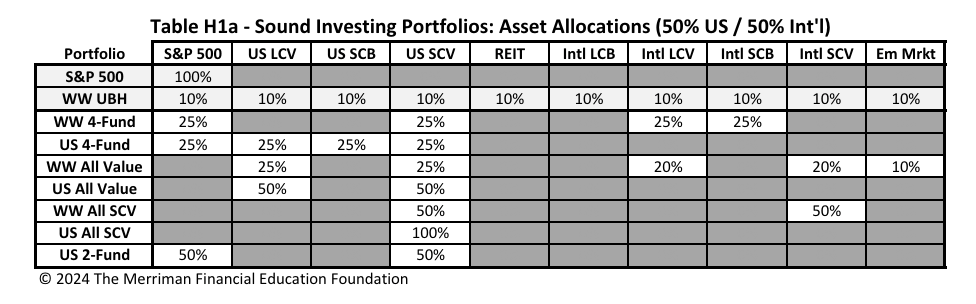
Along the top, nine other asset classes are labeled with letters. In order, the labels stand for U.S. large-cap value, U.S. small-cap blend, U.S. small-cap value, U.S. real-estate investment trusts, international large-cap blend (analogous to the S&P 500), international large-cap value, international small-cap blend, international small-cap value, and emerging markets.
The S&P 500 is included for comparison purposes, and because it’s the most common equity asset class that investors have.
Incidentally, the long-term returns of the S&P 500 are virtually identical to those of the Total Market Index VTSAX, which some investors favor. Over the past 96 years, the compound average return difference between the two is a mere 0.1%, with the S&P 500 holding the advantage.
On the line below the S&P 500 is the Ultimate Buy and Hold Strategy, which I described in the second article in this series. You’ll see that this portfolio has a small slice of every asset class in the table. That’s good for diversification. But owning 10 funds is too cumbersome for most individual investors.
A few years ago, our foundation’s research director, Chris Pedersen, found that just four of those 10 asset classes produced very similar long-term results (both in terms of return and risk). You’ll see that in the Worldwide 4-Fund portfolio.
The next line shows the U.S.-only version of those four asset classes.
Next, the Worldwide All Value portfolio uses five asset classes to invest exclusively in value stocks to produce a sort of Warren Buffett-on-steroids approach.
In the table, that’s followed by the U.S. version of that concept. These two all-value portfolios are aggressive and volatile and don’t include growth stocks.
You might notice that every combination in the table includes small-cap value stocks. Historically, they have produced the highest long-term returns.
Although small-cap value stocks are not suitable for a lifelong portfolio, either one could be a valid choice for an investor in their early 20s. The idea would be to invest the first five years of contributions, then simply leave that portfolio alone until retirement. That could turn out to be an excellent long-term investment.
Finally, there’s the ultrasimple U.S. 2-Fund Portfolio, which captures the comfort and familiarity of the S&P 500 along with the high long-term returns of small-cap value.
You’re probably curious to see how these combinations have performed. You’ll find that information in another table, below and also available on my website. Daryl Bahls, our director of analytics, put this table together, presenting this information in a better way than I’ve seen it anywhere else.
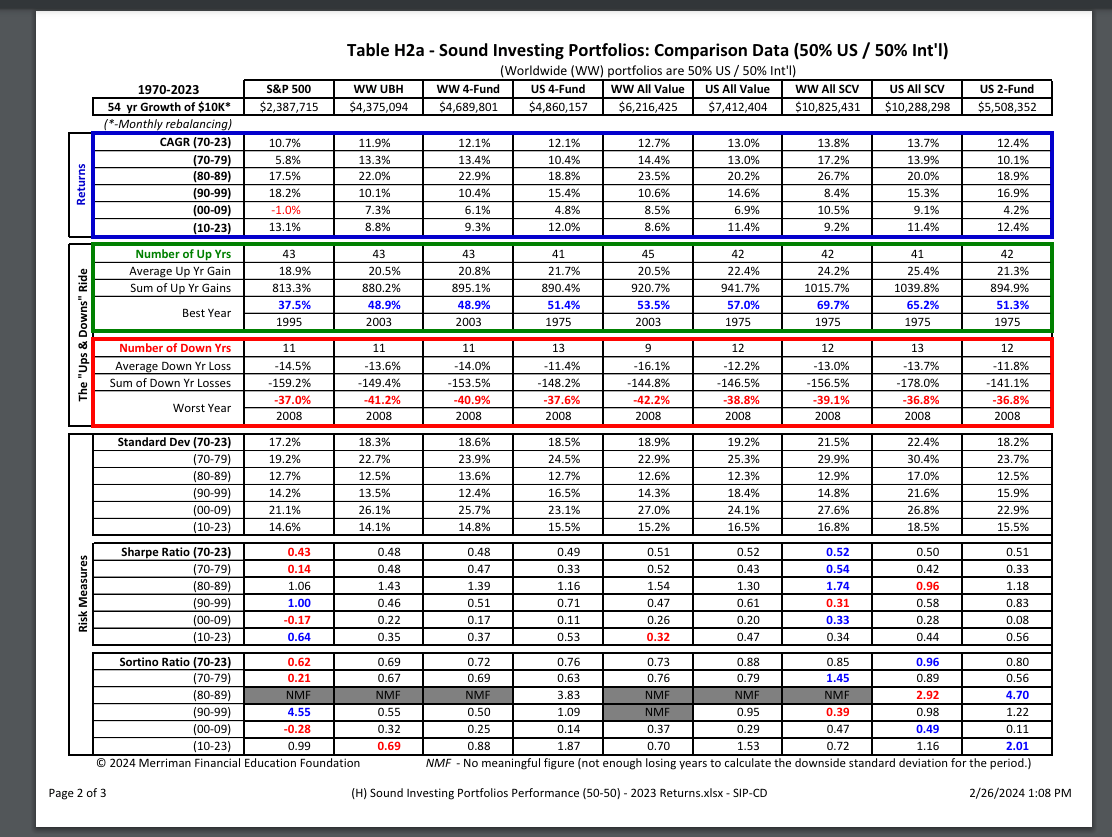
Sure, it’s got lots and lots of numbers, but you don’t have to study them all. I’ll walk you through the most important ones.
The very top line shows, for each portfolio I’ve outlined above, how much you would have made if you had invested $10,000 at the start of 1970 and then left that investment to grow for 54 years, through the year 2023.
You’ll see they vary all the way from about $2.4 million to $10.8 million.
Below that there’s a box outlined in blue that shows the compound annual growth rate (CAGR) for each combination for the entire period and separately for four individual decades plus the 24-year period 2010 through 2023.
If you look at the line for 1970 through 1979, you’ll see the returns varied greatly, from a low of 5.8% for the S&P 500 all the way up to 14.4% for Worldwide All Value.
While a decade is not a lifetime, 10 years of returns that are substantially below average can be very discouraging. But you can cheer yourself up if you look at the U.S. 4-Fund strategy, which significantly outperformed the S&P 500 in four of the six time periods shown.
In the ‘90s, the S&P 500 was the star performer. But that index had a dismal showing from 2000 through 2009, while every other combination did much better.
While there was no huge difference in the numbers of winning and losing years for each combination, the cumulative gains and cumulative losses makes an interesting comparison.
For example, the annual gains in the S&P 500 totaled about 813%, vs. 895% for the U.S. 4-Fund Strategy. And though the difference was smaller, the S&P 500 had more cumulative losses.
For each combination, you can compare the best individual year and — more important for deciding the strategy that might be right for you — the worst individual year.
I understand many investors are uncomfortable with the idea of small-cap value stocks. But I wonder: Which combinations would investors choose if the labels were gone and all they saw were the results. (That would be similar to a blind tasting of wines.)
No single portfolio is best in every regard. But fortunately, you don’t have to be stuck with only one portfolio for life. I suggested earlier that young investors could choose only small-cap value for five years, then keep that portfolio to grow. From then on, they could choose something else until retirement, and transition to a more conservative mix of equities during retirement.
No matter how you allocate the equities in your portfolio, it’s very important to control the overall amount of risk you take. That’s the topic of the next installment of this Investor Boot Camp 2024 series.
And in subsequent articles, you will learn smart ways to accumulate money, smart ways to withdraw money when you’re retired, and much more.
For a more detailed discussion of today’s topic, check out my podcast, Sound Investing Portfolios 2024 Update. I’ve also recorded a video with the same title.
Richard Buck contributed to this article.
Delivery Method. Paul Merriman will send stories to MarketWatch editors on a biweekly basis. Licensor may republish such stories 24 hours after publication on MarketWatch with the attribution.