
Our Mission: Empower Do-It-Yourself Investors with Free Academic-based Research & Resources for Life-long Investing
Want great stock-market returns without great risk? It’s possible if you do these two things.
Reprinted courtesy of MarketWatch.com
Published: December 15, 2023
To read the original article click here
Investors want lots of things, but two of them stand out above all others: They want above-average long-term returns without taking additional risk.
Fortunately, it’s not hard to get those results. First, you have to diversify beyond the familiar and comfortable S&P 500 index SPX ; second, you need patience to wait for your results, which won’t happen all at once.
If you can do those two things, history overwhelmingly shows the odds are stacked in your favor. If that seems too good to be true, I’m about to show you the numbers-based evidence.
Getting to the long term
The no-additional-risk zone seems to start at 15 years out, and I’m going to adopt that for the sake of discussion. The hard part is getting through those first 15 years.
Imagine you’re a first-time investor with a sum of money to commit for your retirement. You choose a portfolio allocation with a good long-term record, and you get started.
In the next one year, two years, five years, one of three things is likely to happen.
- Your investments might do very well.
- Your investments might have a dismal time of it.
- Maybe you’ll wind up with about the same amount you started with.
Which one it will be is a matter of luck you can neither predict nor control. If you pay a lot of attention to your early results, you’re likely to learn an unhelpful lesson.
In the first case, you could conclude that you’ve got it all figured out, that investing is easy. In the second case, you might decide the market is too risky, and you can’t stand to see your dollars vanish week after week. In the third case, you might conclude that the whole thing is relatively pointless, at least for you.
Because unexpected things always happen, many investors never make it to the 15-year mark.
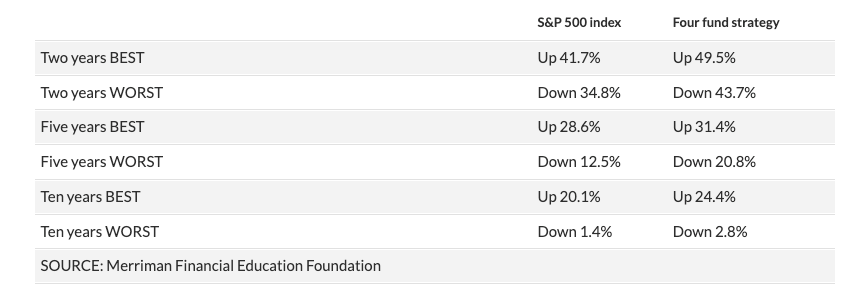
Here’s a quick look at how short-term returns can be all over the map. The table compares the S&P 500 with a four-fund strategy that is equally weighted in four U.S. asset classes: large-cap blend, large-cap value, small-cap blend, and small-cap value.
Table 1: Range of compound annual returns, 1928-2022
That’s the bad news. The good news is that there’s a relatively simple way to get through this part of the journey. It was described in 1987 by Bill Gates when he was asked how often he checked the value of his stock in Microsoft MSFT, 1.28%.
“About once a month,” he said. “I focus on running this company. That’s something I can do something about.”
For the first 15 years or so, Gates’s example is worth following.
All the things that make your portfolio go up or down are essentially noise. Your job should be to ignore the noise and focus on living your life while you keep adding to your savings.
After the early years
Since 1928, after patient investors made it out to 15 years, the noise and long-term losses started to fade into the background.
There were 80 15-year periods through 2022, and even in the worst of them, both the S&P 500 and the four-fund strategy wound up in the black — although not by much. In each case, the worst 15-year compound annual growth rate was up 0.6%.
The worst 20-year periods were better, though still not terrific. The S&P 500’s worst 20-year showing was a compound annual return of 3.1%; for the four-fund combo, the corresponding figure was 4.4%.
I’m focusing on the bad times right here because investors need to know that average long-term returns — 11% for the S&P 500 and 13.6% for the four-fund combo — are only averages and should not be relied upon.
There’s another piece of good news underlying these numbers. The worst 40-year periods (8.9% for the S&P 500, 10.8% for the four-fund combo) occurred way back in the 1930s. I mention them here because terrible times could happen again.
Good news if you’re saving money for retirement
No matter which of these strategies you adopt, if you keep regularly adding to your portfolio, things won’t be as bad as you might think from looking at the numbers in Table 1.
For one thing, dollar-cost averaging insures that over time you buy more shares when prices are low and fewer when prices are higher.
For another, your additional contributions are likely to keep your portfolio balance going up regardless of what happens in the market.
To show this, we looked at the 15-year period from 1970 through 1984, assuming annual investments of $1,000, with the annual amount increased by 3% every year. (We assumed the money was invested once a month, as in a retirement plan.)
Table 2: Portfolio growth 1970 through 1984, S&P 500 index vs. four-fund strategy, $1,000 annual contributions increasing by 3% per year.
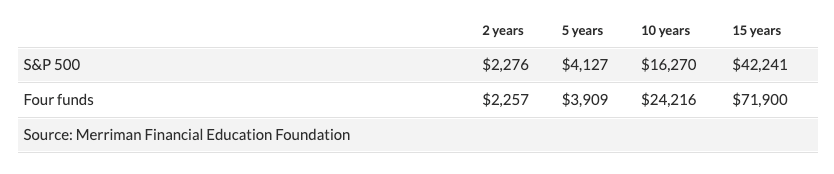
The first five years of this particular period were unusually rough for equity investors. After that, things quickly got better.
After 40 years, the results were much more impressive. At the end of 2009, the S&P 500 account would have been worth $668,733; the four-fund account grew to $1.28 million. In each case, those numbers resulted from total contributions of just $75,404.
The four-fund strategy obviously was the better performer in this comparison. The reason: diversification, especially the addition of U.S. small-cap value stocks.
Why all this matters
Investor psychology is critical to achieving long-term success. If your psyche won’t let you get through those first 15 years, you’ll never make it to the latter years of increasing payoffs.
Here are three important steps to help you do this.
First, follow the example set by Bill Gates.
Second, keep regularly adding money regardless of what the market is doing at the moment.
Third, choose a good time-tested portfolio strategy and don’t second-guess yourself.
I’m a data-driven guy, and I assume that (like me) you want to see more numbers.
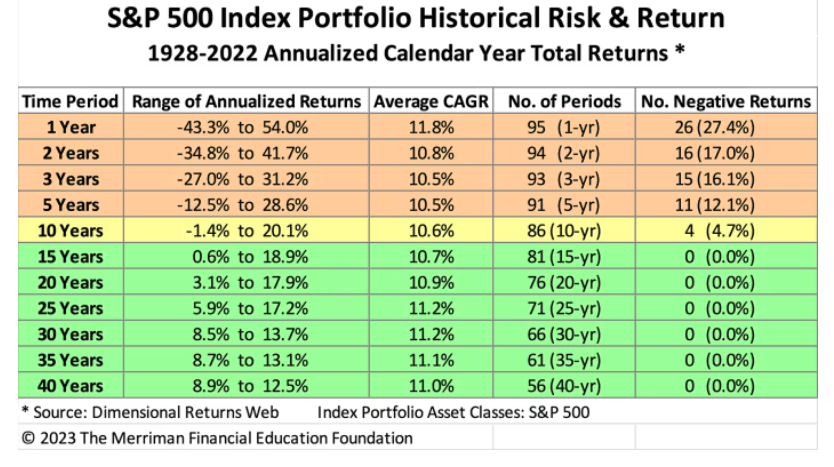
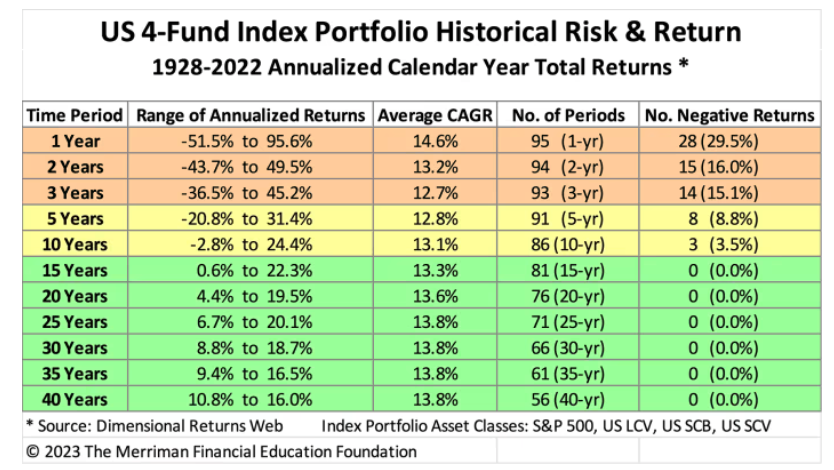
Below are two colorful tables showing the best, worst, and average compound returns over time periods ranging from one to 40 years.
Yellow lines indicate fewer than 10% of periods had negative returns; green lines indicate that all periods were positive.
To understand the right-hand column, look at the top line for the four-fund portfolio; it indicates that 28 of the 95 one-year periods had negative compound returns. Three lines down, you’ll see that only eight of the 91 five-year periods were negative.
There’s a lot of information in these tables, as well as similar tables for small-cap value and a U.S. two-fund portfolio, included in my podcast, “A new way to look at the risk and return of equity asset classes.”
Delivery Method. Paul Merriman will send stories to MarketWatch editors on a biweekly basis. Licensor may republish such stories 24 hours after publication on MarketWatch with the attribution.
The Merriman Financial Education Foundation is a registered 501(c)(3) organization founded in 2012.
All donations are used to support our work. Deductions are permissible to the extent of the law.
Contact us at info@paulmerriman.com
All information on this site is provided free of charge (with the exception of books for sale) and is funded in full by The Merriman Financial Education Foundation.
Anyone wishing to use this educational information in web-based or printed materials are welcome to do so with the following attribution and link:
“This information freely provided courtesy of PaulMerriman.com.” We would also appreciate a copy and link of where it has been published via email.

All Rights Reserved