Our Mission: Empower Do-It-Yourself Investors with Free Academic-based Research & Resources for Life-long Investing
How to turn small amounts of money now into huge sums later — and why you should move beyond the S&P 500
Reprinted courtesy of MarketWatch.com
Published: April 11, 2023
To read the original article click here
My most basic message today is one you’ve heard—probably more times than you wanted to: In order to secure your financial future and someday retire, you must save money.
Just beyond that top-level advice, you can discover something very interesting: How you invest your savings matters. A lot.
This is Part 4 in a series of articles I think of as Boot Camp for Investors 2023.
- The first installment was The best way to invest for retirement.
- The second was Seven simple portfolios that have beaten the S&P 500 for more than 50 years.
- The third was How to control your investment losses.
Today I’ll show you how much more money you are likely to make over the long run if you diversify beyond the familiar S&P 500 SPX, -0.72%.
You can’t buy past results, but you can learn a great deal from them.
If you’re a do-it-yourself learner and love to roll up your sleeves in source material, the Merriman Financial Education Foundation has created a document made up of nine tables of returns over the past 53 calendar years, from 1970 through 2022.
Each of these tables has 689 numbers, for a total of 6,201, showing year-by-year results for 99 portfolio variations.
Are you rolling your eyes?
Don’t worry. You don’t have to study those numbers. I’ve done it for you.
Below, I’ll distill this into just one table with only 18 numbers. This will show you how much difference it can make to invest beyond the S&P 500.
This may sound vague, so let’s get specific.
The numbers I’m going to share assume you began saving in 1970, committing to set aside $83.33 every month, which works out to $1,000 a year. In addition, you committed to increasing your investments by 3% every year after that, in order to take inflation (and supposedly your growing earning power) into consideration.
That means you set aside $85.83 a month in 1971, $88.40 in 1972, and so on.
(If you want to assume you start with a higher monthly figure, just multiply the table results. For example, if you start with $500 a month or $6,000 a year, multiply by six.)
Let’s compare three equity portfolios, each made up of only U.S. funds, so there’s nothing international here.
- The first is ultrasimple: the S&P 500 index all by itself.
- The second is a four-fund combination with equal parts of the S&P 500, large-cap value stocks, small-cap blend (a mix of growth and value) stocks, and small-cap value stocks.
- The third has two funds: large-cap value and small-cap value.
Because you probably aren’t planning for 53 years of investing ahead of you, I’ve broken down the growth of each portfolio so you can see how it would have fared one decade at a time.
Table 1: Growth of three equity portfolios, 1970-2022
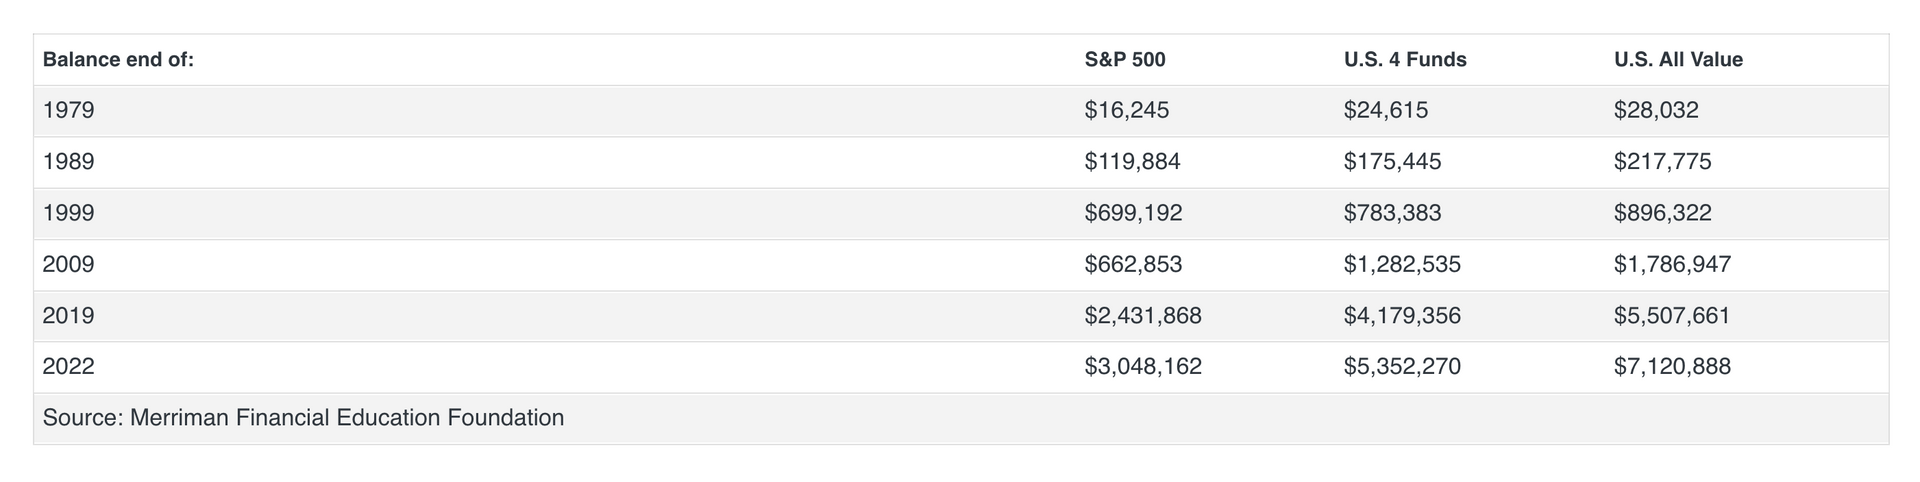
Those 18 numbers can tell you a lot. The two most obvious lessons are the value of time and the big differences that come from diversifying instead of relying entirely on the S&P 500.
The diversification involved adding small-cap stocks and value stocks.
In the early years of an accumulation program like this, the majority of your account value comes from the money you yourself put in.
When I looked at each year’s results of these three investment combinations, I saw that in the first 20 years, there was only one case in which the balance declined from one year-end to the next. The reason: With that single exception, the annual investment was greater than the losses in the market.
But eventually, what happens in the market becomes the dominant factor.
From 2000 through 2009, the annual contributions totaled $27,726. Even after that, the S&P 500 index fared so poorly in those years that the year-end balance declined from $699,192 in 1999 to $662,853 in 2009.
In that same decade, the 4-Fund Combo balance rose by 64%, and the All-Value portfolio nearly doubled.
In my mind, that makes a strong case for diversifying beyond the S&P 500.
In the end, what an investor wants is lots of dollars. In the three years 2020 through 2022, the S&P 500 portfolio grew by $616,294, the U.S. 4-Fund Combo by $1.17 million, and the All-Value portfolio by $1.61 million.
I could go on and on and expand the discussion to include other portfolios as well as various combinations of bonds and equities.
But I would rather use your time and attention to look at a few important lessons regarding saving money for your financial future.
1. We’ve seen that in the early years, the amount you invest will make more difference than the returns you get. That could discourage some people; but long-term investing works only if you keep going.
2. Whether you like it or not, luck (both good and bad) will play an important part in your long-term success. If you started saving in 2000 (bad luck) and invested only in the S&P 500 (perhaps a less-than-optimal decision), the next 10 years would have been an extremely frustrating experience.
But had you started in 2009 (good luck), your first 10 years would have been very encouraging in any of these three portfolios.
3. Over the long haul, your choice of investments has an enormous impact on your ultimate success.
4. I don’t make guarantees very often. But here’s an exception: No matter when you start or what you invest in, you will ultimately fare better if you save more.
Finally, here’s another guarantee. When you’re ready to retire and set up distributions, you will be glad if you have more money instead of less.
That’s the topic of my next article in this series.
For more on this topic, check out my video and my podcast.
Richard Buck contributed to this article.
Paul Merriman and Richard Buck are the authors of ‘We’re Talking Millions! 12 Simple Ways to Supercharge Your Retirement.’ Get your free copy
Delivery Method. Paul Merriman will send stories to MarketWatch editors on a biweekly basis. Licensor may republish such stories 24 hours after publication on MarketWatch with the attribution.